

Thursday, October 11, 2012
AAPL Trade
Just before the close I added an AAPL Ratio Butterfly. I believe that there is not much risk on the downside. The RB is designed to be profitable above 575. I don't expect it to go in that direction and am rather looking to harvest profits as we hit first 10% and then 15% on a journey upward. I love butterflies. They can be structured to fit a scenario while at the same time giving enough protection when my view is wrong, mostly still making a profit.

Wednesday, October 10, 2012
Taking my Profit
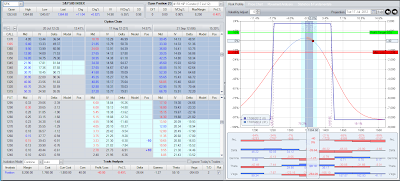
The pic below shows a trade I have on: a double butterfly. You can see details of the trade on the pic. There was a long call as part of the trade but I have taken profit on it. The position is showing a profit of almost 10%. The problem is SPX is more difficult to get fills in than RUT and I can't get out without giving some profit back.
While ETFs are easier to get fills in, the commissions are too high. The problem with SPX is that it's still pit traded and has high volume - usually from big players. My small size seems to be ignored. I don't seem to have the same problem with the RUT. While I'm an ex local, getting rid of the pits couldn't happen soon enough for me. Even with the technological aids that didn't exist when I was in the pit, pit traded instruments are a lot less efficient for retail traders than the electronic traded instruments.

While ETFs are easier to get fills in, the commissions are too high. The problem with SPX is that it's still pit traded and has high volume - usually from big players. My small size seems to be ignored. I don't seem to have the same problem with the RUT. While I'm an ex local, getting rid of the pits couldn't happen soon enough for me. Even with the technological aids that didn't exist when I was in the pit, pit traded instruments are a lot less efficient for retail traders than the electronic traded instruments.

Monday, October 1, 2012
Finding Trades
I'm flat on all my trades except the SLV which I'm trying to close. I got out of the calendar part of the trade and now just have the butterfly. I'm trying to sell it at 1.50 which will put me into profit of about 1%+. This recovers the loss on the calendar. Still not a fan of calendars. It's partly me and partly calendars. They are just not as good a risk/reward as butterflies.
Trading options is either keeping all your eggs in the same basket and watching it carefully which is what I did mostly on the floor - I had two guys working for me and each traded just one market. The other way is to create a diversified "portfolio" of trades. Somehow, off floor, I'm not comfortable carrying anywhere near as large a position as I used to carry when I was on the floor. Here I feel like a retail trader when on the floor I was the market, or at least one component of it.
My butterfly trades have been very solid but a black swan is always hiding in the bull rushes so I decided that diversification was the way to go. I day trade futures for a couple of hours and then want to do other things away from my computer. The technology is there to do that with option trading so the challenge was to find enough trades on a regular basis.
After trying a lot of things, I decided to turn to the technology I know. I've set up an algo to look at a list of stocks, ETFs and indexes against which I do option trades. I have two live algos: one uses daily data and the other uses bars drawn every 3 hours. I can do this on both TradeStation and MultiCharts.
I have a strategy live that finds the trades. OptionFlo. The trades are on the underlying and don't get executed automatically. What happens is that I get an email alert when there is a possible trade. It can only happen on the US open and at set 3 hour intervals so I know when I could expect an email if I'm not on a PC.
When I get a mail, I jump onto my iPad or laptop and have a look at the chart on my VPS in the cloud. If I like the chart I put on a trade - a vertical credit spread, Iron Condor or Butterfly. This process can take about 6 minutes as my morning prep gives me a heads up of the possibilities - alerts are not a surprise. I also get emails if the market hits milestones on positions I may need to protect. All exit orders are in the market GTC after a trade is initiated.
I'm using both MultiCharts and TradeStation for OptionFlo. The big advantage with this methodology is that I have a structured and consistent process for finding trades that have been back tested as both high win rate and profitability. The pic below shows the RadarScreen that looks for trades. There are two screens: a daily and a 180 minute. When I get an alert, I click on the symbol which is linked to a chart and I make my assessment on whether to take a trade. The shorter term trades are either a Vertical Credit Spread or a Directional Butterfly. If the markets look like they are staying in a range then an Iron Condor is my trade of choice.

Wednesday, September 19, 2012
State of Play
Here are a couple of the positions I have on at the moment: a butterfly and an Iron Condor. These, I guess, are bread and butter trades. I'm looking at putting on some bear cll vertical spreads now that there is some topping indications. AAPL is quite hard at this level in case it does break the psychological $700 convincingly. But somehow I think it's all in the price unless iTV or a mini iPad rear their heads.


Below is a learning trade, for me, at least. I trade Calendars badly. I think it's because I never liked trading them on the floor and I usually only made markets in the front month where the volume was in those days.
This SLV position started off as a -10/+10 calendar that went negative. I wrapped it in a butterfly which I do like to trade so I could get to break even on the trade. The way I trade calendars at the moment is to require almost instant gratification. This one went negative too quickly so I did the butterfly adjustment. It's a tiny position as I'm still trying to find a better way of trading calendars but I'm showing the trade as an example of the adjustment.

Friday, September 7, 2012
Wednesday, September 5, 2012
Covered All Open Positions
I covered the SPX Iron Condor position at -1.25 after buying it at -2.30 making a profit of over 10% for the trade. I also covered my RUT Butterfly at 2% profit. I am waiting for the ECB announcement tomorrow before I take any more swing trades. I'm smelling a possible rally from here. I say "smelling" because there are only the earliest of technical signs that may not result in the rally coming. However, due to the uncertainty, I'm sure I'll be able to put on bigger size at a better price when I'm confident in what I'm seeing.
Friday, August 24, 2012
Time is on My Side
I try and develop option trades that give me plenty of time to make decisions. Option trades can be much more forgiving of timing and that means not being stopped out unnecessarily - one of the main reasons people lose trading.
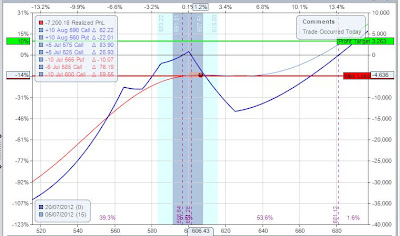
Well, the market did co-operate and I sold the second butterfly right at the ES support. The total trade made almost 10% on my max Reg-T margin of $102,000 since August 6.
My "problem" now is to get re-invested by finding another trade with a high win rate. Well, no problem really because I just put on a new RUT butterfly for the October expiry. As you can see in the pic, the delta/theta is normal around 1 to 1. If the market moves down to my level, I take profit and if it rallies enough I add another butterfly to the position to make my teepee into a marquee. Having a very specific trading plan for the trade makes it easy to manage in less then 5 minutes a day.

The SPX Iron Condor trade is still cooking. I'm up about 3% at the time of writing this.
Thursday, August 23, 2012
Took Some Profit
I took some profit on the RUT trade by taking off the higher butterfly. I'll put it back if RUT rallies to around 820.00 again, depending on context. Pic shows current RUT trade. My delta/theta ratio is a bit high, so I'll need to decide whether to do anything about that today if I can't take more profit on the other butterfly.

Wednesday, August 22, 2012
State of Play
I have two positions on at the moment: a RUT butterfly play and a SPX Iron Condor. Both were underwater for a couple of days. The RUT trade was a scale in trade and was expected to show an unrealized drawdown. Full details are on the pics.
Both are getting into profit as the market topped here. I have orders in to take profits in the market although I don't expect to have them all filled today unless the coyotes see that they have walked over the edge of the cliff.


Both are getting into profit as the market topped here. I have orders in to take profits in the market although I don't expect to have them all filled today unless the coyotes see that they have walked over the edge of the cliff.


Wednesday, August 15, 2012
Marquee Trading
I've had a few questions about my option trading, so here is a description of what I do. In addition to the very directional trades I make, as I have said before, I also do so called income trades.
These so called income trades are structured like the trades I did on the floor. On the floor, I made my money in two different ways:
- The edge from making markets and selling above fair value and buying below fair value. I made money off the spread I made. The more volume there was, the more I made. We - me and two traders I employed - traded about 2,500 contracts a day on busy days, usually with a tick edge at least.
- Price erosion due to the passing of time. For this to happen I traded within a very firm structure: short the middle strikes and long the wings. I had to make a choice of whether to be long or short gamma taking into account possible changes in market direction and volatility. We used futures to balance delta when needed. My usual stances was to be short gamma so I could benefit from the erosion. How short of gamma depended on my view of price movement and volatility. Of course I sometimes was wrong in my opinion and lost money.
On the floor, I was to a certain extent at the mercy of the "paper". My job was to take the other side of their trades while at the same time having a directional view, volatility view and strategy.
Since coming off the floor, I have, until the last few years, concentrated on futures trading rather than options, as the technology and liquidity of trading options from off the floor was not something I felt comfortable with. However things changed as option volumes have grown exponentially and I have done well since I started trading options again.
To trade options from off floor, I needed a strategy. I based what I do now on what I did on the floor with the added benefits of:
- being able to choose my trades rather than take the other side of customer trades
- creating a rule based strategy that is objective not subjective and that has been validated with backtesting.
- a written detailed trading plan
Tuesday, August 14, 2012
Monday's Trades
I had a busy Monday. Firstly, I put on a Directional Iron Condor trade in the SPX. It was biased a little on the downside as I think the market will back down or go sideways. When I take profit depends on how fast the market is moving and what adjustments I need to make.
As you can see, the position went into a small profit fairly quickly as the market moved down after I put the trade on. It's about a $15,500 Reg-T margin and I can earn between 10% and 30% during the next month based on the $4,600 credit I took in when I put the trade on.

Monday, August 13, 2012
Possible Entries Today
I did my analysis and I have 4 new possible entries today. Whether they trigger or not will depend on the market. For the BUYs I want to see strength and for the SELLS I want to see weakness. I have alerts enabled that will send me an e-mail/SMS when and if any of my levels are penetrated.

Friday, August 10, 2012
Vertical Credit Spread or Broken Wing Butterfly
One of the trades I do is picking tops and bottoms in a swing move. I don't have to be too good at this if I use the right strategy and the math works.
Once I have identified the trade, I need to pick the strategy. This post is looking at a sell of the SPX yesterday. I identified the top and decided that I would use the weekly SPX as the vehicle. My next job was to choose the strategy.
Below as two pics. The first one is the VCS (vertical credit spread) where I sell, in this case, a CALL and buy a call 2 strikes further out. The second pic is the BWB (broken wing butterfly) where I sell 2 CALLS of the same strike as I did in the VCS and bought the CALL the next strike down as well as 2 strikes up.


Let's look at the math.
The VCS has a risk/margin of about $545 with a max possible profit of $453. The BWB has a risk/margin of about $355 and a probable max profit of $141. I say "probable" because there is a small chance that the price will expire at the short strike and provide a windfall of about $550.
Say I have $10,000 to put into the trade.
I can trade 10000/545 of the VCS = 18.35 sets.
I can trade 10000/355 of the BWB = 28.17 sets
The VCS has a max poss profit of 18.35 x 453 = $8312 with a probability of 54.4% of making it.
The BWB has a max prob profit of 28.17 x 141 (ignoring the windfall) = $3972 with a 56.5% probability of making it.
I have another alternative: the 1420/1430 VCS.

I have another alternative: the 1420/1430 VCS.

This variation has the following stats:
12.38 sets per $10,000, $808 risk/margin and $190 max poss profit with a 77.4% probability of making it. By the close I was 2% into my profit.
The considerations about which to use include:
- Probability of success
- Ease of adjustment
- probability of the windfall (I can maybe widen the price range of the windfall area)
- Ease of getting a fill
Tuesday, August 7, 2012
Vertical Credit Spreads
Those following the trades in my previous post about Vertical Credit Spreads should see how nice a trade they can be.
The trades went into profit straight away as the market moved in a direction faourable t the spreads, which was the whole idea. However, had I not been nimble enough or been too greedy to take profit, even though the market rallied in subsequent days, there was still profit and time to take them off.
I will be showing more of these very directional trades each week using both vertical credit spreads and broken wing butterflies.
Wednesday, August 1, 2012
More Specific Trades
I do quite a few trades every day as part of the way I diversify risk. I'm going to put more structure into this blog by posting some more specific directional trades, as well as a monthly income type trade with a directional bias.
Yesterday, my aim was to put these trades on:

They all filled (at mostly different prices) except the KO, which did not fill- but I am still working it. I'm trying to earn about 15% on my margin and stop myself out with a new high unless price is rejected there.
Monday, July 30, 2012
Out of SPX
I took my profit on the SPX. See the pic. I'd been in the trade long enough and I took a 6% profit and re-invested my margin in another trade. By the close the trade would have been down. My profit taking was more good luck than good management, or maybe I saw something that I didn't know I was seeing. Anyway, if a trade is making a reasonable profit and looks like stalling then it's better to grab the profit than give it back.

Thursday, July 26, 2012
Updates AAPL and SPX
I scratched my AAPL trade (broke even except for commish). My idea of a better reception for the quarterly news was wrong. What was good that even when I wasn't right, I didn't lose on the trade. Options are a great vehicle.
The SPX trade is still open. As you can see from the risk graph below, I'm almost at my 10% profit, but not quite. I've been in the trade since July 17 and would like to get out now, so I might accept 8% rather than 10%. I'll see how the day progresses.

I'm planning on putting on a major RUT butterfly today or tomorrow. Major due to its size and type. I'm going to scale into the position if the market co-operates. More details when the first leg is on.
Meanwhile, I'm heading to the beach this morning as it's going to be a scorcher here in France. More vistors arriving here tomorrow. I'm only day trading when I have time and letting Flo, my algo, do the daytrading most of the summer and these option trades only need looking at once a day. Freedom!
Wednesday, July 25, 2012
AAPL Losing Trade, So Far, SPX In Profit
So far, the AAPL trade from yesterday looks like a losing trade. The numbers last night caused a late sell off in AAPL. I'll manage the trade and try to get out at break even or a loss if the market doesn't allow that.
My SPX trade has almost hit a 10% profit and I will be looking to take it off at 10%.
I'll post the results.
My SPX trade has almost hit a 10% profit and I will be looking to take it off at 10%.
I'll post the results.
Tuesday, July 24, 2012
Apple Earnings Spec Trade
I bought a Broken Butterfly on July AAPL. I BOT +590 PUT, --585PUT, +575PUT. I'm banking on either a good reaction to the earnings report tonight or one that doesn't take out my short 585 PUTs. I've traded July as they expire on Friday.
This is a pure speculative trade and I'm risking a maximum of just a bit under $10,000 and I can make 28% on the trade. The maths of this trade only work with the high win rate I have with them.

This is a pure speculative trade and I'm risking a maximum of just a bit under $10,000 and I can make 28% on the trade. The maths of this trade only work with the high win rate I have with them.

Wednesday, July 18, 2012
Made to Measure
I believe that by having a directional bias I am able to better pick a strategy to use. I have three variations of butterflies and condors that I can choose from. If I want to be very directional then there is the Vertical Spread, but this has more risk and a lower win rate if the directional bias is wrong. With my butterflies and condors I am profitable in most cases, even if my directional bias is wrong.
It took me two days to get filled on this Iron Condor. +1425V/-1415C/-1255P/-1245P. I'm showing it as a 10 lot trade with margin of less than $10,000. I received a credit of £1.80 or $1,800 to make this trade. My goal is to keep as much of this money as I can between now and when I take it off before expiry which is in 32 Calendar days.
As you can see in the software, the position has over a 78% chance of making money, even if I don't adjust it. I'll use some of the $1,800 to make adjustments to the trade if I need to. The high of the ES hit a daily FavFib area and I expect a pullback within a day or two. This is one of four criteria I have in order to make this trade. I'll take the position off if I make 10% on my margin or about $900 per 10 contracts. I have a specific trading plan to manage the position until then, as the market unfolds.

Monday, July 16, 2012
Monitoring Option Positions - Away from Home

I've finally found the tool that gives me freedom - I get alerts when I need them and can put on a hedge if required. It's the Samsung Galaxy Note II due out in September, according to this blog. All I need to find is a case that I can hang on my belt. My iPad is getting too cumbersome to carry. I'm day trading less. Flo and options carry most of the load these days. A couple of hours discretionary trading is what happens most days.
Samsung Galaxy Note II looks pretty big and runs IceCreamSandwich or Jelly Bean. I will be able to connect to all my brokers and my charts/FloBot through the Cloud and actually see what I'm looking at. It's going to be more convenient to carry than my iPad.
What do I alert and what can I do about them from a small device? Lots of choices.
Firstly, I alert myself for the UNDERLYING - the stock or index - hitting a price above AND below the previous close. The prices I pick are prices where I would need to do something.
OK, I get an alert - an email or SMS (I can choose). When this happens, I don't have to figure out what to do because I have already worked it out - before I left home.
Usually, I will want to go to delta neutral first. This will give me time to make any adjustments I need to make. I can go delta neutral quite easily using an underlying and I can do this with a couple of clicks even on a small device like a smartphone or Pad. For example, I may have a RUT butterfly on and I would need to do something if price goes above 858.00 or below 723.00. I know what my delta position on the butterfly would be at each of those prices because I looked it up on my risk graph or brokers greek table. I also know that I will use, say, 1 Russell future for every delta point I need to hedge.
I can execute this a couple of different ways:
- I can leave a sell stop and a buy stop with my broker to make the trade when either of these prices are hit, or,
- I can execute them myself when an email/SMS alert is received.
I have an account with TDAmeritrade and get the ThinkOrSwim software for free. This software allows trading, monitoring and backtesting although it does not carry a cumulative total of profitability after adjustments, but you can keep track of this manually. The added bonus here is the smartphone app with alerts.
This whole operation is a very rare occurrence and is designed only for black swan events. It's mainly to give me peace of mind. I usually only look and adjust my option positions once a day and usually at the same time of day and at a time when I'm usually at my workstation or my laptop in a hotel. I can travel and have a life away from my workstation and keep on earning. No daytrading but certainly option trading and managing Flo's autotrading.
Friday, July 13, 2012
Out of the RUT
I exited the RUT trade yesterday. It was not an easy trade and I had locked it into a stable position as I reported in a previous post. I had a great opportunity yesterday to get out at a small profit and be ready to reuse the margin I had tied up in the trade.

Monday, July 9, 2012
Monday Update
Just discovered some comments that I wasn't notified were there awaiting moderation. I'll catch up answering these tomorrow.
We're getting a lot of volatility in the stock markets. Around 10% down and then 10% up. Markets were awesome until about June 26 and have been a bit more difficult since. However, I closed the month of June well ahead of my plan. July is starting slowly but there are 22 days left in this month and I expect to hit my plan of at least 10% return.
My AAPL trade closed on Friday for a 4% loss. The trade just didn't work. Same, -4%, with the TLT. I've changed my directional view on the TLT, so closed the position.
My RUT position will be decided this week. I'm expecting a pullback and then a rally. If the rally comes early then no adjustment, otherwise I'll need a tweak.
I had an EEM trade on that I took off today at +7%. It was a butterfly with a short bias that partly balanced the RUT long bias. As I'm looking for the RUT to rally from here I decided that the EEM could rally with the RUT so I should take profits.
Friday, July 6, 2012
New Position and More Adjustments
I put on a new position and made some more adjustments after my post of yesterday.
AAPL now looks like this:

My cumulative P&L is down about 6% on Max margin. I'll try and get out at break even on this trade as it hasn't worked. I'm prepared to take a loss too if it doesn't look like this will happen.
The new trade is on TLT.

This is a Broken Butterfly and is part of a bigger position that I want to put on. Downside is a locked in Profit and my present break even on the upside is 131.49.
AAPL now looks like this:

My cumulative P&L is down about 6% on Max margin. I'll try and get out at break even on this trade as it hasn't worked. I'm prepared to take a loss too if it doesn't look like this will happen.
The new trade is on TLT.

Thursday, July 5, 2012
AAPL and RUT
Stablizing my AAPL position. I'll see what I do next after a day or two. I added a butterfly and bought some calls back. I'm going to exit this position at break even when I can. It will probably need some more adjustments. If I can see a short term top, I'll sell the August CALLs I am long and then cover the August PUTs after it has pulled back. Anyway, that's the current plan, subject to change.
Looks to me that the RUT may rally so I've converted the position into a broken Butterfly. This will lock me into a sure profit of at least 4% unless price goes below about 755.


Looks to me that the RUT may rally so I've converted the position into a broken Butterfly. This will lock me into a sure profit of at least 4% unless price goes below about 755.

Monday, July 2, 2012
Batman
I put on the RUT position below on Thursday and Friday. There are three trades in the position so far. They are Butterflies and the idea is to capture a wide tent and earn 10%. The position is a little down as RUT rallied on Friday. On Friday, I added another 10 sets to Thursday's original butterfly - 710/760/810 AUG PUTs and later in the day on Friday I added the 870/820/770 AUG PUT butterfly.
This gives me a tent of 738 to 841 wide for break even and a decent maximum profit in the tent that will allow adjustments if needed. I hope to add to this position so that the Reg-T margin is about $200K. A 10% profit will then earn me $20,000 and I hope to do this in the next 30 days or less.
A down move will push me towards profit and an upmove will allow me to add to the position. We'll see how it goes.

The AAPL position is still on with price moving back into the middle of the tent. I'm not making any money on that trade yet as volatility and price moved against me. Let's see what happens this week as theta (price erosion) kicks in.
Thursday, June 28, 2012
Double Diagonal
I have a new AAPL trade today. I bought an AAPL Double Diagonal for 20.20. I'm looking to earn 10% on my Reg-T margin. You can see the numbers on the pic below. This is not a directional play but an earnings play. This is not my favourite strategy, but in a range bound market it can do OK. It will take a while as you can see from the Theta (premium erosion) number at the bottom of the pic.


Tuesday, June 26, 2012
RUT Profit Taken
The market did it's thing and dipped to allow me to take my profit as planned. I'm sitting the next day or two out until I see which way the order flow will go. Although my strategies are of the so called income type, the basis of the way I trade is directional bias as it makes the trades work so much more quickly.
Monday, June 25, 2012
Broken Butterfly
I added a couple of butterflies on Friday: RUT (Russell) and XLE (Energy).
The first pic is the XLE. I put the position on at a credit to me of 0.28. I took it off today at about 0.20. The position I put on is known as a Broken Butterfly - a trade I like a lot as you only have to figure out where the price won't go, but if it goes there you can still make a windfall profit. I do tend to take profits quite quickly because I don't have a problem finding another trade to put on.

The RUT trade moved considerably in my favour today too. As you can see in the pic below, there is a $33,000 Reg-T margin and I'm up 8% over the weekend. The position is a regular PUT Butterfly and I had hoped to scal into a larger trade. I'm working an order at the moment to exit at a 11.5% profit. I'm the only offer of the butterfly at that price at the moment. I have a few more on than the number in a pic as I run a number of different accounts so I may get part filled with one broker but not another. I don't know why that happens but it does.The kind answer is that one is put on at an earlier time than the other.

If you haven't traded options much and want to follow along, I'd read as much on the web as you can find about option strategies. They are not as complex as they seem although a lot of people add unnexessary complexity. The basis of my option trading is the same as the basis of my day trading: I envision the probabilities and put on a trade that fits. The extra advantage of options is that I don't necessarily have a losing trade if my vision is wrong. I usually need to be vilently wrong for there to be a loss.
I'll report on my RUT trade as it develops.
Friday, June 22, 2012
Taking RUT Profits
I started taking profits on my RUT position yesterday as the down move began. The RUT position was comprised of 4 separate overlapping butterflies. As per the pic below, I had taken 3 of them off. At that point, I had realised a profit of about $1,100 or 2.6% . That left the position with a $2,300 profit in it as you can see from the stats at the bottom of the pic below. This is over 5% on my max theoretical margin. My actual margin is less due to Portfolio margining, but I calculate my returns on the Reg-T margin as I allocate those funds to the trade.
The position left was 800/750/700 July PUT Butterfly. I placed a SELL order in the market for this butterfly at a higher price than current. The position was within the tent and any move against this would mean a new adjustment, either buying a call or call spread or adding another butterfly. It would have depended on when and how the move took place. I had a smell of a possible RUT rally as we had poked our heads through support, so taking profits like I did was prudent. The "first rule of fight club" as the movie said, is PRESERVE CAPITAL.
In fact, the market continued the down move and allowed me to harvest some nice profit. I exited the last RUT butterfly as the market fell to about 766.75.
I earned over 7% on the trade overall. It is important to note that the position was against me by over 12% during the trade but that was within my trading plan. My goal was to scale into the position and then scale out to take profits.
I have other trades on at the moment in GLD and FXE and will be looking to put on a new trade today, probably in the RUT. Not sure whether it will be a flavour of Butterfly or an Iron Condor.

Tuesday, June 19, 2012
Widening the Tent 2
I didn't finish the previous post as I had not finished my additions to the RUT trade yet.
The pic below shows two additions to the trade as I progress getting the full position on. I'm about half way to my maximum margin allocation, although there is a large reserve in addition to this if anything unexpected happens.
I have used almost $50,000 Reg-T margin which is the basis for my percentage profit calculation. I need a pullback in the RUT to make my profit or alternatively, that the market expires within the risk tent which is the heavy line in the pic.

The numbers along the bottom of the pic show my current Greeks. Still negative delta, which is as planned. Adding to the position as I have, has mitigated negative effects to a certain extent. If the pullback happens now rather than after a further up move, I'll be able to make the profit I want more quickly.
I've been in this trade just 8 days and we are about 30 days to expiry. The fastest theta decay has now kicked in and there is still enough time premium to make any needed adjustments. I'd really like to be out of the trade within 14 more days.
The pic below shows two additions to the trade as I progress getting the full position on. I'm about half way to my maximum margin allocation, although there is a large reserve in addition to this if anything unexpected happens.
I have used almost $50,000 Reg-T margin which is the basis for my percentage profit calculation. I need a pullback in the RUT to make my profit or alternatively, that the market expires within the risk tent which is the heavy line in the pic.

I've been in this trade just 8 days and we are about 30 days to expiry. The fastest theta decay has now kicked in and there is still enough time premium to make any needed adjustments. I'd really like to be out of the trade within 14 more days.
Widening the Tent
Firstly, good to see your comments guys. Thanks.
Option Net gives both a visual and a mathematical representation of risk and a what the position can do under different scenarios. But perhaps the most powerful feature is that I can go back in time and use the 5 minute historical data to fairly accurately back test strategies. If you are a reader of the EL day trading blog you will know what how important I think back testing is. The P&L in the software is cumulative for the strategy I am doing. That is to say, I put the position on and then I make adjustments and the software keeps track of each adjustment. In this way, if I am trying to make, say, 10%. It shows the 10% based on all adjustments and calculates it against the maximum margin I have used.
Margin is another issue. If you are a regular retail customer with less than about $100k in your options account, you get Reg-T margining which is a SPAN based margin. If you are a bigger customer, you can get Portfolio Margins which are much lower. I calculate my returns on the Reg-T even thought I get the benefit of Portfolio.
As we get going with the blog, I will try and explain more about the strategies.
You should understand that my strategies are so-called income strategies but based on a directional bias. This means that my trades can mature much more quickly and that my capital turns over more often = higher percentage return per year.
Monday, June 18, 2012
AAPL and Europe
I took my profit at 11% on my AAPL position, as was set in my trading plan. Pic below shows how it looked on Friday when the trade was made.

The Greeks voted but things seem far from over. The guy that failed to form a coalition government in May now has to try again. A tough ask. Maybe I'll have an opportunity to add another butterfly to my RUT position if the market can rally a little more. As of writing early in the morning London time, ES is trading at 1343.00. I need the equivalent RUT price to be higher before I can add.

The Greeks voted but things seem far from over. The guy that failed to form a coalition government in May now has to try again. A tough ask. Maybe I'll have an opportunity to add another butterfly to my RUT position if the market can rally a little more. As of writing early in the morning London time, ES is trading at 1343.00. I need the equivalent RUT price to be higher before I can add.
Friday, June 15, 2012
Added To RUT And Apple Still Cooking
I added to my RUT position as planned. I added another butterfly centered at 750 PUTS with 50 wings. It gave me a bigger tent by moving the break evens out. I should hit my target within 7 to 14 days if we stay in the range within the tent. I will add another butterfly if the market rallies - GREEK ELECTIONS !!!!
Pic below shows what the position looks like now. The position is down 8%, which is expected as the market rallies. It needs a pullback to become profitable. A rally will allow me to make the position larger and earn more.

The Apple trade is still cooking. I'm in profit but haven't yet hit my target.
As with my daytrading, my option trades are pretty structured and easy to manage.
Thursday, June 14, 2012
AAPL
This is a trade I added on Tuesday late. It's developing, as you can see, and I'm up about 4%. My target is 10% on margin. The first pic is the entry and the second is how it looks today.


The options software is OptionsNet.


The options software is OptionsNet.
Wednesday, June 13, 2012
Butterfly
This is the first post in this swing trading options blog. I'll start off with a trade from last week. It was a directional butterfly, as are most of my trades. The short strike is in the direction I expect the market to go. My goal is to make money from the both the directional move and time decay. In this way, I can make money even when my direction choice is incorrect. I use my usual methodology to choose direction with daily data.
There are times when the position will need to be adjusted, but I do not monitor these trades throughout the day, just once a day. I have profit taking orders in GTC and alerts by email in case something unusual happens.
The pics below show the opening of the trade on 11 June and the closing on the same day with an 11% profit. This is highly unusual. My expectation is to run a trade for 3 to 15 days. You can see the positions annotated on the risk chart. My commissions are about 75 cents a contract.


I put on another trade yesterday - a butterfly. It's the first tranche of a position I want to put on as the market rises. I'll add similar butterflies with different centres as the market rises. If the market falls then I'll take profit on this butterfly.

Subscribe to:
Posts (Atom)